
Basic Content Reporting using the 5.2.1 Search API
Turn on suggestions
Auto-suggest helps you quickly narrow down your search results by suggesting possible matches as you type.
Showing results for
- Alfresco Hub
- :
- ACS - Blog
- :
- Basic Content Reporting using the 5.2.1 Search API
Basic Content Reporting using the 5.2.1 Search API
- Subscribe to RSS Feed
- Mark as New
- Mark as Read
- Bookmark
- Subscribe
- Printer Friendly Page
- Report Inappropriate Content
2 Oct 2017
8:11 PM
Introduction
Alfresco Search Services 1.1.0 and Alfresco Content Services 5.2.1 added more support for query aggregation. ACS 5.2 included facet fields and facet queries. ACS 5.2.1 adds:
- Stats
- Ranges
- Intervals
- Pivots
- Pivots with stats or ranges
These break downs work using SOLR 4 in ACS 5.2.1 as well as Alfresco Search Services 1.1.0 - with some minor limitations when using SOLR 4.
The examples presented here can be found as part of a postman collection here. Some example reports can be found here. Remember to set your hostname and port. There are more examples and additional details in the postman collections than those presented here, including other changes and additions to the search public API.
Stats
Stats faceting generates summary statistics for a field and can be applied to numeric, date and text types. The metrics available depend on both the data type and search technology ( SOLR 4 vs Alfresco Search Services). Stats supports the following metrics:
| Metric | Default | Numeric | Date | Text |
|---|---|---|---|---|
| min | Yes | Yes | Yes | Yes |
| max | Yes | Yes | Yes | Yes |
| sum | Yes | Yes | Yes | No |
| countValues | Yes | Yes | Yes | Yes |
| missing | Yes | Yes | Yes | Yes |
| mean | Yes | Yes | Yes | No |
| stddev | Yes | Yes | Yes | No |
| sumOfSquares | Yes | Yes | Yes | No |
| distinctValues | No | Yes | Yes | Yes |
| countDistinct | No | Yes | Yes | Yes |
| cardinality | No | Yes | Yes | Yes |
| percentiles | No | Yes | No | No |
Stats can be used to find summary statistics for everything that matches any query. For example, the statistics about content size in a folder.
{
"query": {
"query": "NPATH:'1/Company Home/Sites'"
},
"filterQueries": [
{
"query": "TYPE:content AND -TYPE:\"cm:thumbnail\" AND -TYPE:\"cm:failedThumbnail\" AND -TYPE:\"cm:rating\" AND -TYPE:\"app:filelink\" AND -TYPE:\"fmost\""
}
],
"paging": {
"maxItems": "1"
},
"stats": [{
"field" : "content.size",
"label" : "Content Size"
}]
}
This will return some default statistics. Note that countValues is used to distinguish the stats metric from the normal facet metric count. If stats are nested in a pivot then there will be both count and countValues metrics.
Ranges
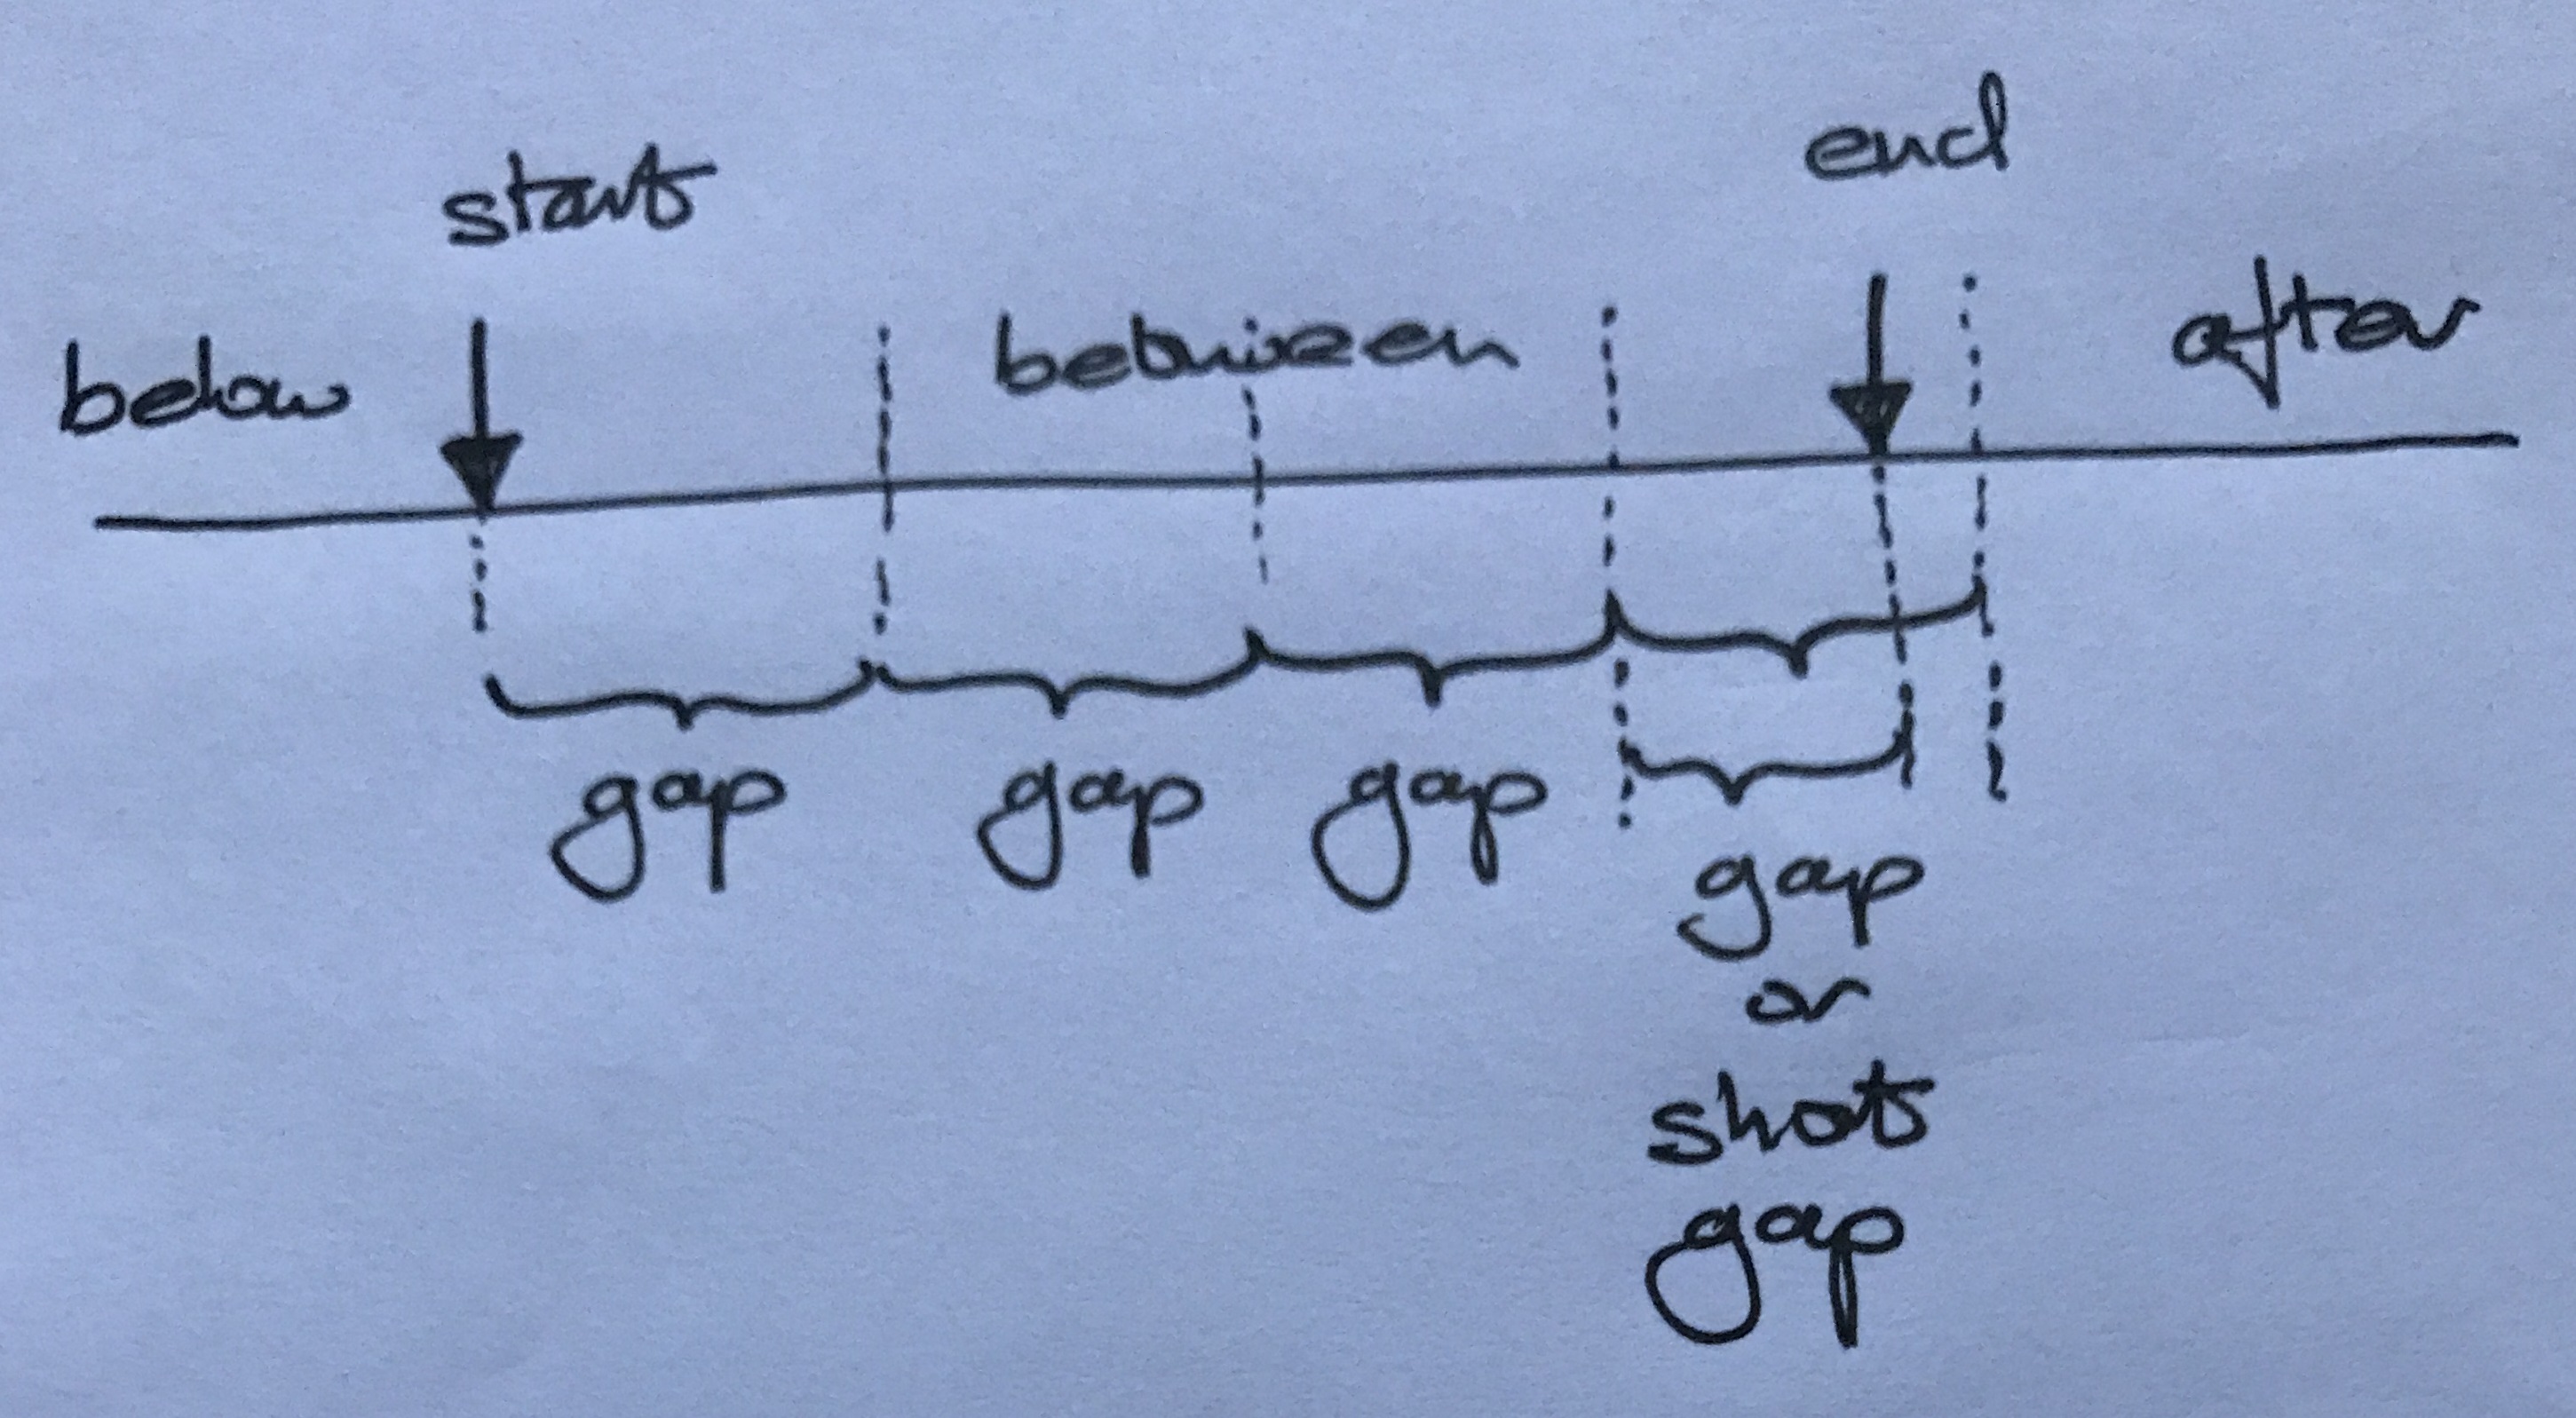
Range in its simplest form defines a start point, an end point and a gap. The data is split into buckets of size gap, starting at the start point and ending at, or after, the end point. Adding an option for a hardened end point forces a smaller final bucket to finish exactly at the end point.

For each bucket you can control which edge bounds are included in the bucket. The lower option includes the lower bound of all buckets. The upper option includes the upper bound of all buckets. The edge option includes the lower bound of the first bucket and the upper bound of the last bucket.
The default is lower + edge.

Ranges can be used on date and numeric types. When using date types, if the bounds are defined using SOLR math expressions then the computations are sensitive to timezone.
For example:
{
"query": {
"query": "name:*"
},
"ranges":[ {
"field": "created",
"start": "NOW/YEAR-4YEARS",
"end": "NOW/YEAR+1YEAR",
"gap": "+1YEAR"
}],
"localization":
{
"timezone": "GMT+6",
"locales" : [ "fr", "en" ]
}
}
Produces entries like:
"facets": [
{
"type": "range",
"label": "created",
"buckets": [
{
"label": "[2012-12-31T18:00:00Z - 2013-12-31T18:00:00Z)",
"filterQuery": "created:[\"2012-12-31T18:00:00Z\" TO \"2013-12-31T18:00:00Z\">",
"metrics": [
{
"type": "count",
"value": {
"count": "0"
}
}
],
"bucketInfo": {
"startInclusive": "true",
"start": "2012-12-31T18:00:00Z",
"end": "2013-12-31T18:00:00Z",
"endInclusive": "false"
}
},....
The response includes a metric for the count and also how each bucket was defined - including the behaviour of the bounds.
Intervals
Intervals at first look like they do the same thing as ranges. However, the buckets can be defined any way you like. They can overlap, leave gaps, include other buckets, etc. You can also apply intervals to text. The more general use of intervals is limited as they can not be nested in pivot facets.
For intervals, you define any number of sets. Each set has a start and an end with options for the bounds - startInclusive and endInclusive. Again for dates, using date math the computation respects timezone.
Here is one example from the collection:
{
"query": {
"query": "name:*",
"language": "afts"
},
"filterQueries": [{"query": "cm:created:[* TO 2016>"}],
"localization":
{
"timezone": "GMT+6",
"locales" : [ "fr", "en" ]
},
"facetIntervals": {
"intervals": [
{
"label" : "TheCreated",
"field": "cm:created",
"sets": [
{
"label": "lastYear",
"start": "2016",
"end": "2017",
"endInclusive" : false
},
{
"label": "currentYear",
"start": "NOW/YEAR",
"end": "NOW/YEAR+1YEAR"
},
{
"label": "earlier",
"start": "*",
"end": "2016",
"endInclusive" : false
}
]
}
]
}
}
Pivots
Pivots are nested field facets. For example, a field facet on SITE with a nested field facet for creator. Pivots will provide counts for each grouping along with sub-totals. The public API takes advantage of this nesting by defining all the groupings individually and then how to nest them. It is then easy to change the nesting. In the future it also allows for reusing groupings and defining default groupings.
Pivots by default only do counting - we will get to that later.
A pivot today can only support one nested break down at each level. You can however define as many pivots as you like. Some of the facet field options are ignored when used in a pivot as they are not supported.
So here is the pivot example we just described:
{
"query": {
"query": "name:*"
},
"facetFields": {
"facets": [
{"field": "SITE", "label": "Site"},
{"field": "creator", "label": "Creator"}
]
},
"pivots" : [
{
"key": "Site",
"pivots": [
{
"key": "Creator"
}
]
}
]
}
The pivot key needs to refer to a facet label (or the label for a stats or range facet....)
Pivots with stats or ranges
Pivots can include reference to a single stats or range facet as the last key. These stats or range references can not include any further nested facets. So you can nest as many field facets as you like with a stats or range facet at the bottom.
Here is an example content size statistics broken down by site.
{
"query": {
"query": "name:*"
},
"facetFields": {
"facets": [
{"field": "SITE", "label": "site"}
]
},
"stats": [
{
"field": "content.size",
"label": "size",
"min": true,
"max": true,
"stddev": true,
"missing": true,
"sum": true,
"countValues": true,
"sumOfSquares": true,
"percentiles": ["1","12.5","25","50","75","99"],
"distinctValues": false,
"countDistinct": true,
"cardinality": true,
"cardinalityAccuracy": 0.1
}
],
"pivots" : [
{
"key": "site",
"pivots": [
{
"key": "size"
}
]
}
]
}
Each pivot facet level will get all the stats - so sub-totals etc are included if you nest pivots.
Limitations
Pivots with nesting stats and range do not allow some options. Range and stats have to come at the bottom of the pivot. With ranges at the bottom you just get a count metric - so there is no way to do date vs general stats. Lookout for more news on this in the next month or so.
It is possible to split breakdowns out table style and reorder them - its just a bit of a pain to do and make sure you have the right sub-totals, if required. Some stats you can reshape (counts, sum); some like percentile will leave you scratching your head or require some manipulation we are not going to cover here.
So for the easy stuff, you can map the results to a table.
| Site | Creator | Doc Count | Content Size |
|---|---|---|---|
| One | Bob | 2 | 400 |
| One | Charlie | 1 | 700 |
| One | 3 | 1100 | |
| Two | Alice | 9 | 900 |
| Two | Bob | 5 | 1000 |
| Two | 14 | 1900 | |
| Three | Alice | 7 | 21 |
| Three | Bob | 9 | 4000 |
| Three | Charlie | 21 | 5 |
| Three | 37 | 4026 |
You can reshape the data by sorting on the grouping fields and build any sub-aggregations. Many tools can help you with the reshape and just need the groupings and metrics. Date ranges can be treated as groupings - but you will just have the count metric.
| Site | Creator | Doc Count | Content Size |
|---|---|---|---|
| One | 3 | 1100 | |
| Three | 37 | 4026 | |
| Two | 14 | 1900 | |
| Three | Alice | 7 | 21 |
| Two | Alice | 9 | 900 |
| Alice | 16 | 921 | |
| One | Bob | 2 | 400 |
| Three | Bob | 9 | 4000 |
| Two | Bob | 5 | 1000 |
| Bob | 16 | 5400 | |
| One | Charlie | 1 | 700 |
| Three | Charlie | 21 | 5 |
| Charlie | 22 | 705 |
Other
The collection and example reports contain more samples than I can cover here. They contain some additional description, cover more data types and describe some typical options you may want to use. The examples also include other functionality added to the 5.2.1 such as: time zone, locales, templates, grouping facet queries, building filter queries for multi-select facets, etc..
Summary
So there are a few examples here and many more in the postman collections. Go explore the options with your data.
You must be a registered user to add a comment. If you've already registered, sign in. Otherwise, register and sign in.
Alfresco Content Services Blog
Ask for and offer help to other Alfresco Content Services Users and members of the Alfresco team.
Related links:
Latest Articles
- Alfresco Community Edition 23.2 Release Notes
- Decommissioning of Alfresco SVN Instances
- Summarization of textual content in Alfresco repos...
- ACS containers and cgroup v2 in ACS up to 7.2
- Migrating from Search Services to Search Enterpris...
- Alfresco Community Edition 23.1 Release Notes
- Integrating Alfresco with GenAI Stack
- Achieving Higher Metadata Indexing Speed with Elas...
- ACA Extension Development Javascript-Console & Nod...
- Hyland participation in DockerCon 2023
- Alfresco repository performance tuning checklist
- The Architecture of Search Enterprise 3
- Alfresco Identity Service End of Life
- Using ActiveMQ with Alfresco 7.4
- Offline/parallel re-indexing with ElasticSearch
We use cookies on this site to enhance your user experience
By using this site, you are agreeing to allow us to collect and use cookies as outlined in Alfresco’s Cookie Statement and Terms of Use (and you have a legitimate interest in Alfresco and our products, authorizing us to contact you in such methods). If you are not ok with these terms, please do not use this website.