Alfresco Monitoring with Docker and ELK
- Alfresco Hub
- :
- Alfresco Premier Services Blog
- :
- Alfresco Monitoring with Docker and ELK
Alfresco Monitoring with Docker and ELK
- Subscribe to RSS Feed
- Mark as New
- Mark as Read
- Bookmark
- Subscribe
- Printer Friendly Page
- Report Inappropriate Content
- 1. Project Objective
- 2. Install Docker on Host machine
- 3. Virtual Memory
- 4. Download “Docker-ELK-Alfresco-Monitoring” container software
- 5. Creating the Docker Image
- 6. Creating the Docker Container
- 7. Starting the Docker Container
- 8. Starting logstash-agent
- 9. Configuring Alfresco to generate data for monitoring
- 9.1 Alfresco Logs
- 9.2 Document Transformations
- 9.3 Tomcat Access Logs
- 9.4 Solr Searches
- 9.5 Database Monitoring
- P6spy
- 9.6 Alfresco Auditing
- 10. Starting and Stopping the logstash agent
- 11. Accessing the Dashboard
- 11. Accessing the container
- 12. Stopping the container
- 13. Removing the Docker Container
- 14. Removing the Docker Image
- 15.Firewall ports
- Happy Monitoring!!!
1. Project Objective
The aim of this blog is to show you how to create and run a Docker container with a full ELK (Elasticsearch, Logstash and Kibana) environment containing the necessary configuration and scripts to collect and present data to monitor your Alfresco application.
Elastic tools can ease the processing and manipulation of large amounts of data collected from logs, operating system, network, etc.
Elastic tools can be used to search for data such as errors, exceptions and debug entries and to present statistical information such as throughput and response times in a meaningful way. This information is very useful when monitoring and troubleshooting Alfresco systems.
2. Install Docker on Host machine
Install Docker on your host machine (server) as per Docker website. Please note the Docker Community Edition is sufficient to run this project (https://www.docker.com/community-edition)
3. Virtual Memory
Elasticsearch uses a hybrid mmapfs / niofs directory by default to store its indices. The default operating system limits on mmap counts is likely to be too low, which may result in out of memory exceptions.
On Linux, you can increase the limits by running the following command as root on the host machine:
| # sysctl -w vm.max_map_count=262144 |
To set this value permanently, update the vm.max_map_count setting in /etc/sysctl.conf. To verify the value has been applied run:
# sysctl vm.max_map_count |
4. Download “Docker-ELK-Alfresco-Monitoring” container software
Download the software to create the Docker container from GitHub: https://github.com/miguel-rodriguez/Docker-ELK-Alfresco-Monitoring and extract the files to the file system.
5. Creating the Docker Image
Before creating the Docker image we need to configure access to Alfresco’s database from the Docker container. Assuming the files have been extracted to /opt/docker-projects/Docker-ELK-Alfresco-Monitoring-master, edit files activities.properties and workflows.properties and set the access to the DB server as appropriate, for example:
#postgresql settings db_type=postgresql db_url=jdbc db_user=alfresco db_password=admin |
Please make sure the database server allows for remote connections to Alfresco’s database. A couple of examples how to configure the database are shown here:
- For MySQL
Access your database server as an administrator and grant the correct permissions i.e.
# mysql -u root -p grant all privileges on alfresco.* to alfresco@'%' identified by 'admin'; |
The grant command is granting access to all tables in ‘alfresco’ database to ‘alfresco’ user from any host using ‘admin’ password.
Also make sure the bind-address parameter in my.cnf allows for external binding i.e. bind-address = 0.0.0.0
- For PostgreSQL
Change the file ‘postgresql.conf’ to listen on all interfaces
listen_addresses = '*' |
then add an entry in file ‘pg_hba.conf’ to allow connections from any host
host all all 0.0.0.0/0 trust |
Restart PostgreSQL database server to pick up the changes.
We have installed a small java application inside the container in /opt/activities folder that executes calls against the database configured in /opt/activities/activities.properties file.
For example to connect to PostgreSQL we have the following settings:
db_type=postgresql db_url=jdbc db_user=alfresco db_password=admin |
We also need to set the timezone in the container, this can be done by editing the following entry in the startELK.sh script.
export TZ=GB |
From the command line execute the following command to create the Docker image:
# docker build --tag=alfresco-elk /opt/docker-projects/Docker-Alfresco-ELK-Monitoring/ Sending build context to Docker daemon 188.9MB Step 1/33 : FROM sebp/elk:530 530: Pulling from sebp/elk ....... |
6. Creating the Docker Container
Once the Docker image has been created we can create the container from it by executing the following command:
# docker create -it -p 5601:5601 --name alfresco-elk alfresco-elk:latest |
7. Starting the Docker Container
Once the Docker container has been created it can be started with the following command:
# docker start alfresco-elk |
Verify the ELK stack is running by accessing Kibana on http://localhost:5601 on the host machine.
At this point Elasticsearch and Kibana do not have any data…so we need to get Alfresco’s logstash agent up and running to feed some data to Elasticsearch.
8. Starting logstash-agent
The logstash agent consists of logstash and some other scripts to capture entries from Alfresco log files, JVM stats using jstatbeat (https://github.com/cero-t/jstatbeat), entries from Alfresco audit tables, DB slow queries, etc.
Copy the logstash-agent folder to a directory on all the servers running Alfresco or Solr applications.
Assuming you have copied logstash-agent folder to /opt/logstash-agent, edit the file /opt/alfresco-agent/run_logstash.sh and set the following properties according to your own settings
export tomcatLogs=/opt/alfresco/tomcat/logs export logstashAgentDir=/opt/logstash-agent export logstashAgentLogs=${logstashAgentDir}/logs export alfrescoELKServer=172.17.0.2 |
9. Configuring Alfresco to generate data for monitoring
Alfresco needs some additional configuration to produce data to be sent to the monitoring Docker container.
9.1 Alfresco Logs
Alfresco logs i.e. alfresco.log, share.log, solr.log or the equivalent catalina.out can be parsed to provide information such as number of errors or exceptions over a period of time. We can also search these logs for specific data.
The first thing is to make sure the logs are displaying the full date time format at the beginning of each line. This is important so we can display the entries in the correct order.
Make sure in your log4j properties files (there is more than one) the file layout pattern is as follows:
log4j.appender.File.layout.ConversionPattern=%d{yyyy-MM-dd} %d{ABSOLUTE} %-5p [%c] [%t] %m%n |
This will produce log entries with the date at the beginning of the line as this one:
2016-09-12 12:16:28,460 INFO [org.alfresco.repo.admin] [localhost-startStop-1] Connected to database PostgreSQL version 9.3.6
Important Note: If you upload catalina files then don’t upload alfresco (alfresco, share, solr) log files for the same time period since they contain the same entries and you will end up with duplicate entries in the Log Analyser tool.
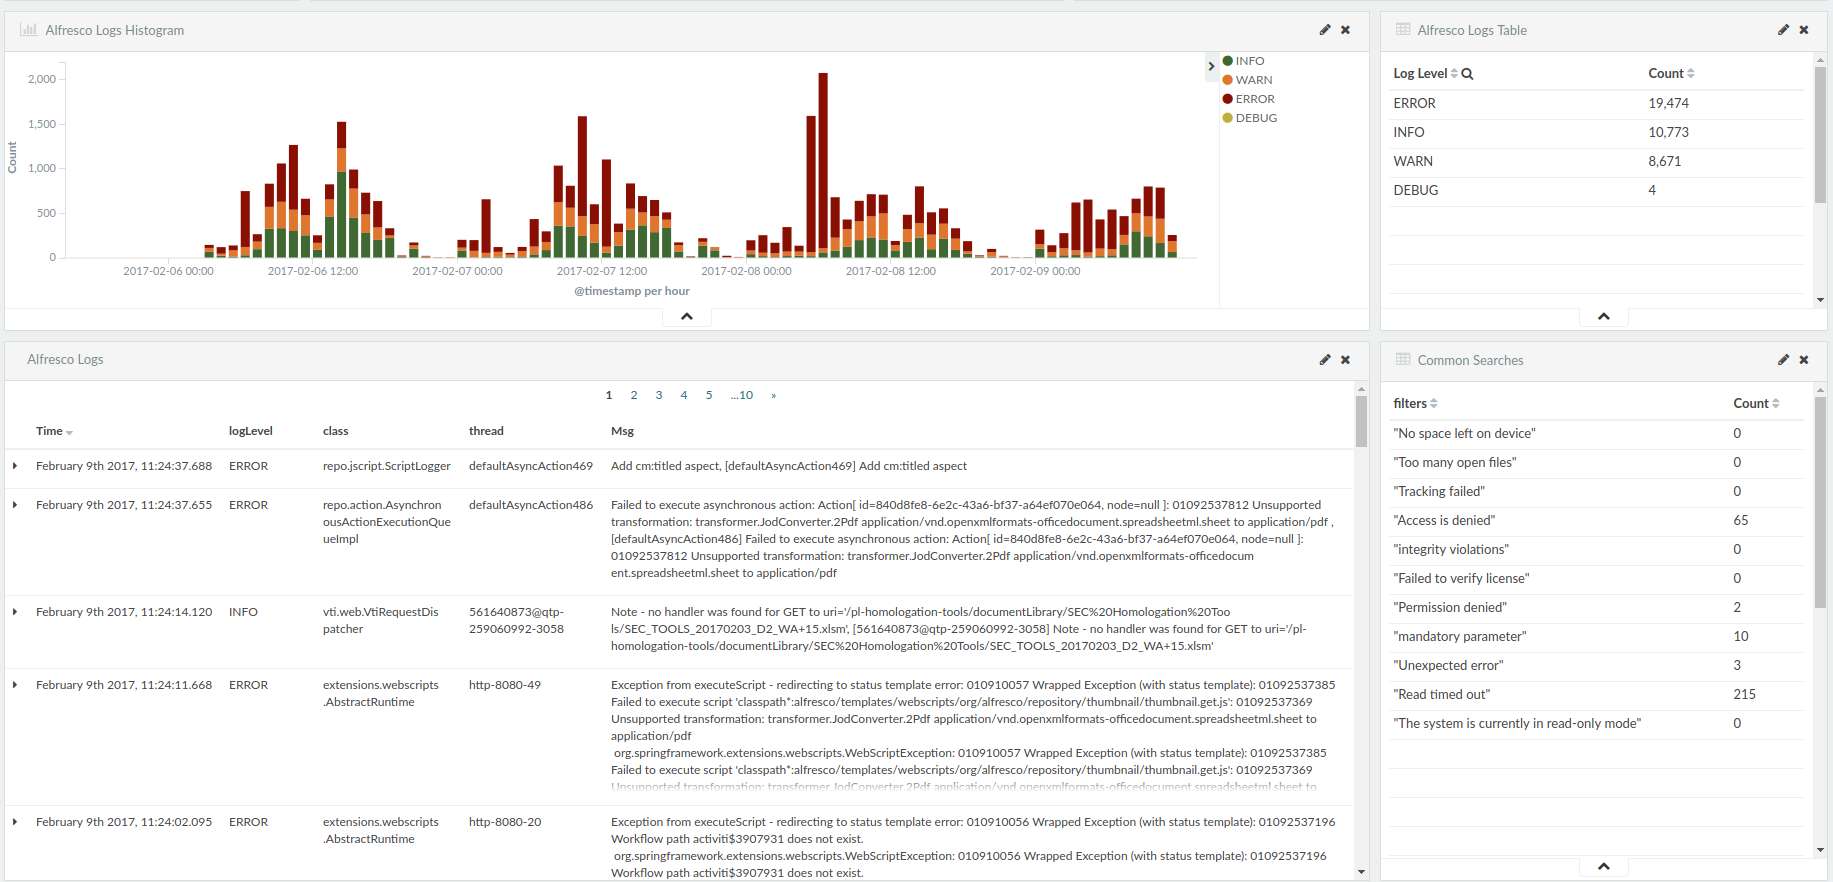
Once the logs are processed the resulting data is shown:
- Number errors, warnings, debug, fatal messages, etc over time
- Total number of errors, warnings, debug, fatal messages, etc
- Common messages that may reflect issues with the application
- Number of entries grouped by java class
- Number of exceptions logged
- All log files are searchable using ES (Elasticsearch) search syntax
9.2 Document Transformations
Alfresco performs document transformations for document previews, thumbnails, indexing content, etc. To monitor document transformations enable logging for class “TransformerLog” by adding the following line to tomcat/shared/classes/alfresco/extension/custom-log4j.properties on all alfresco nodes:
| log4j.logger.org.alfresco.repo.content.transform.TransformerLog=debug |
The following is a sample output from alfresco.log file showing document transformation times, document extensions, transformer used, etc.
| 2016-07-14 18:24:56,003 DEBUG [content.transform.TransformerLog] [pool-14-thread-1] 0 xlsx png INFO Calculate_Memory_Solr Beta 0.2.xlsx 200.6 KB 897 ms complex.JodConverter.Image<<Complex>> |
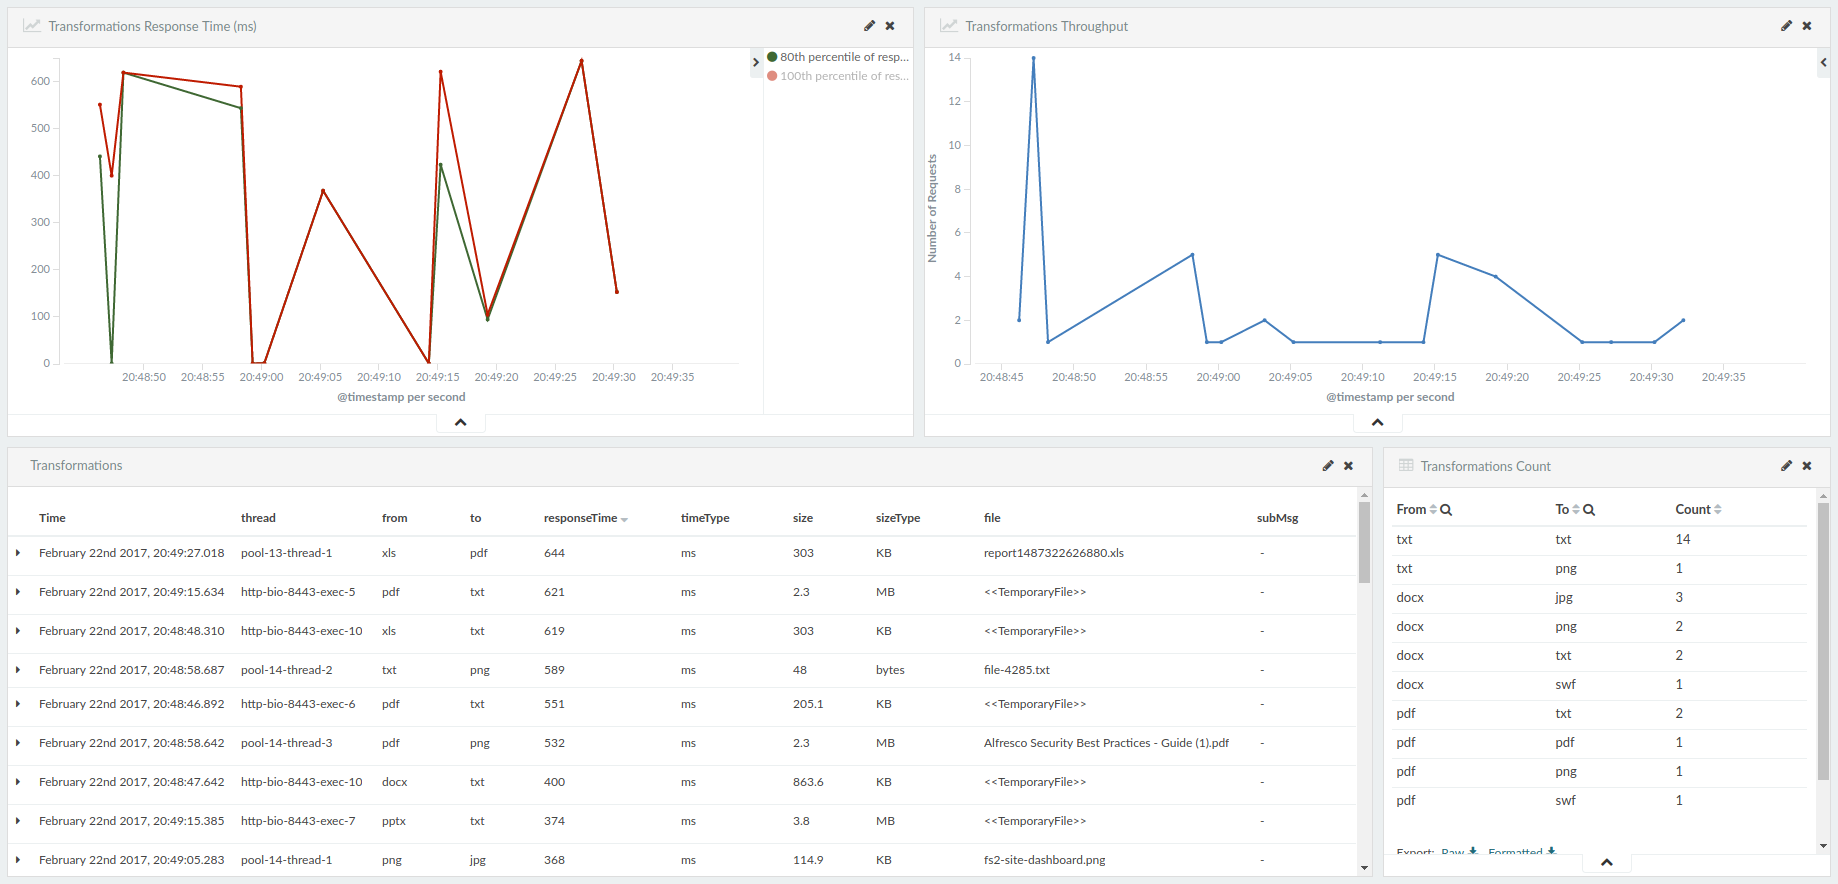
Once Alfresco logs are processed the following data is shown for transformations:
- Response time of transformation requests over time
- Transformation throughput
- Total count of transformations grouped by file type
- Document size, transformation time, transformer used, etc
9.3 Tomcat Access Logs
Tomcat access logs can be used to monitor HTTP requests, throughput and response times. In order to get the right data format in the logs we need to add/replace the “Valve” entry in tomcat/conf/server.xml file, normally located at the end of the file, with this one below.
<Valve className="org.apache.catalina.valves.AccessLogValve" directory="logs" prefix="access-" suffix=".log" pattern='%a %l %u %t "%r" %s %b "%{Referer}i" "%{User-agent}i" %D "%I"' resolveHosts="false" /> |
For further clarification on the log pattern refer to: https://tomcat.apache.org/tomcat-7.0-doc/config/valve.html#Access_Logging
Sample output from tomcat access log under tomcat/logs directory. The important fields here are the HTTP request, the HTTP response status i.e. 200 and the time taken to process the request i.e. 33 milliseconds
| 127.0.0.1 - CN=Alfresco Repository Client, OU=Unknown, O=Alfresco Software Ltd., L=Maidenhead, ST=UK, C=GB [14/Jul/2016:18:49:45 +0100] "POST /alfresco/service/api/solr/modelsdiff HTTP/1.1" 200 37 "-" "Spring Surf via Apache HttpClient/3.1" 33 "http-bio-8443-exec-10" |
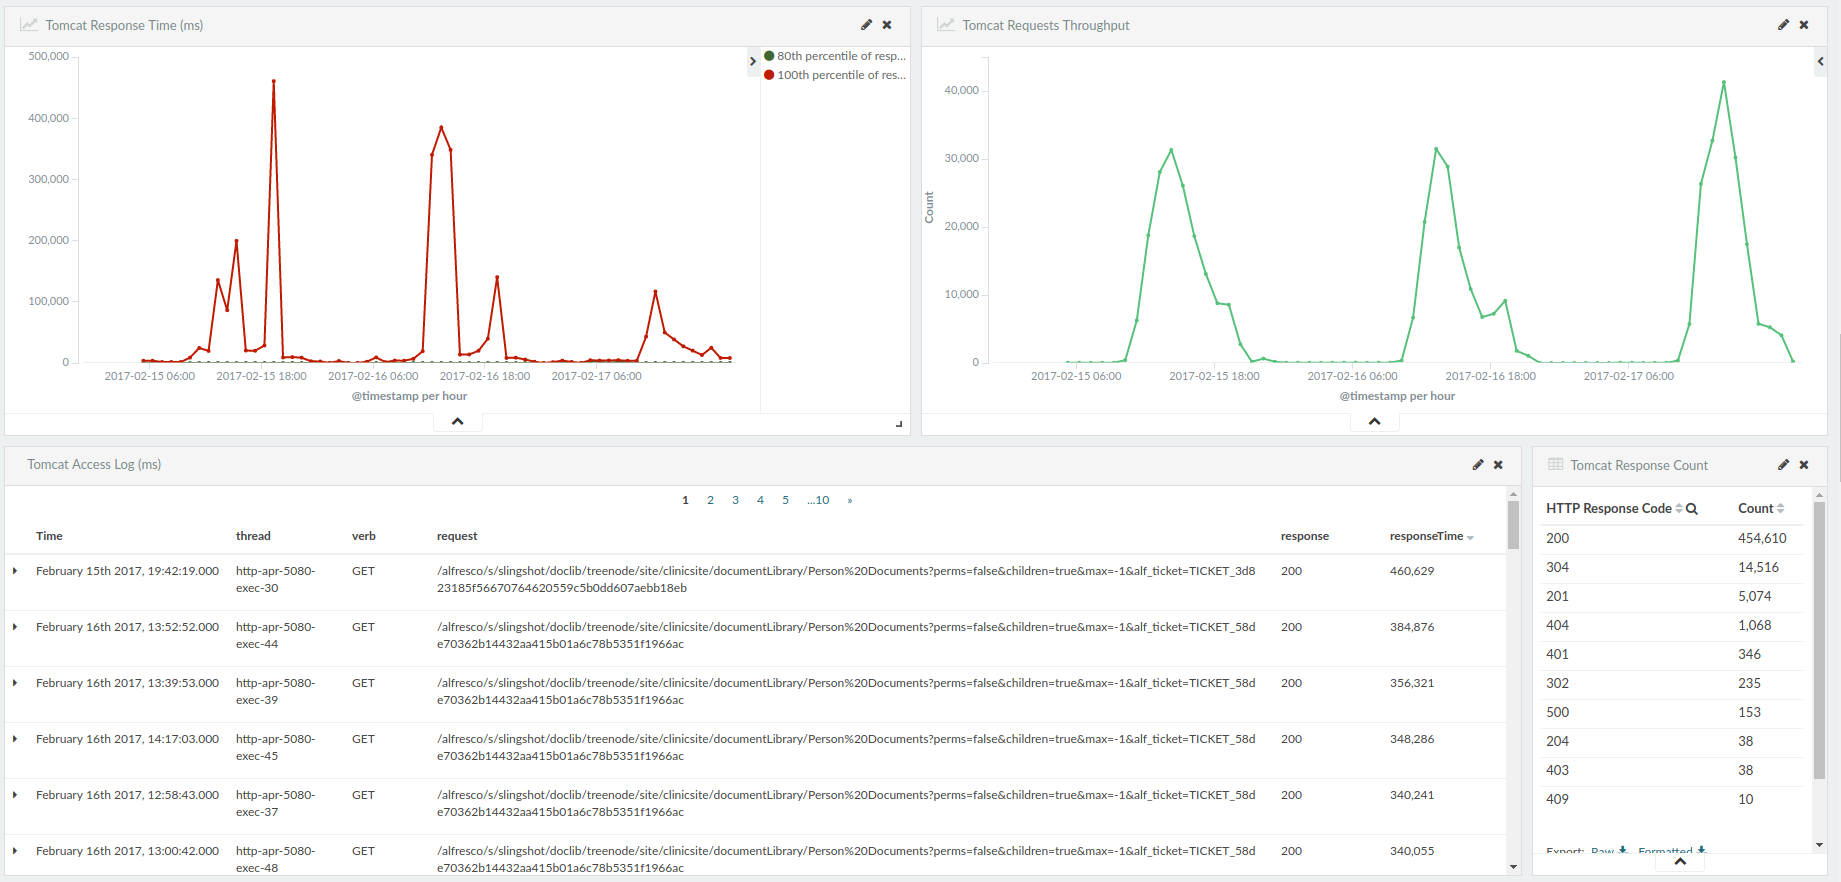
Once the Tomcat access logs are processed the following data is shown:
- Response time of HTTP requests over time
- HTTP traffic throughput
- Total count of responses grouped by HTTP response code
- Tomcat access logs files are searchable using ES (Elasticsearch) search syntax
9.4 Solr Searches
We can monitor Solr queries and response times by enabling debug for class SolrQueryHTTPClient by adding the following entry to tomcat/shared/classes/alfresco/extension/custom-log4j.properties on all Alfresco (front end) nodes:
| log4j.logger.org.alfresco.repo.search.impl.solr.SolrQueryHTTPClient=debug |
Sample output from alfresco.log file showing Solr searches response times:
DEBUG [impl.solr.SolrQueryHTTPClient] [http-apr-8080-exec-6] with: {"queryConsistency":"DEFAULT","textAttributes":[],"allAttributes":[],"templates":[{"template":"%(cm:name cm:title cm:description ia:whatEvent ia:descriptionEvent lnk:title lnk:description TEXT TAG)","name":"keywords"}],"authorities":["GROUP_EVERYONE","ROLE_ADMINISTRATOR","ROLE_AUTHENTICATED","admin"],"tenants":[""],"query":"((test.txt AND (+TYPE:\"cm:content\" +TYPE:\"cm:folder\")) AND -TYPE:\"cm:thumbnail\" AND -TYPE:\"cm:failedThumbnail\" AND -TYPE:\"cm:rating\") AND NOT ASPECT:\"sys:hidden\"","locales":["en"],"defaultNamespace":"http://www.alfresco.org/model/content/1.0","defaultFTSFieldOperator":"OR","defaultFTSOperator":"OR"} 2016-03-19 19:55:54,106
DEBUG [impl.solr.SolrQueryHTTPClient] [http-apr-8080-exec-6] Got: 1 in 21 ms |
Note: There is no specific transaction id to correlate the Solr search to the corresponding response. The best way to do this is to look at the time when the search and response were logged together with the java thread name, this should give you a match for the query and its response.
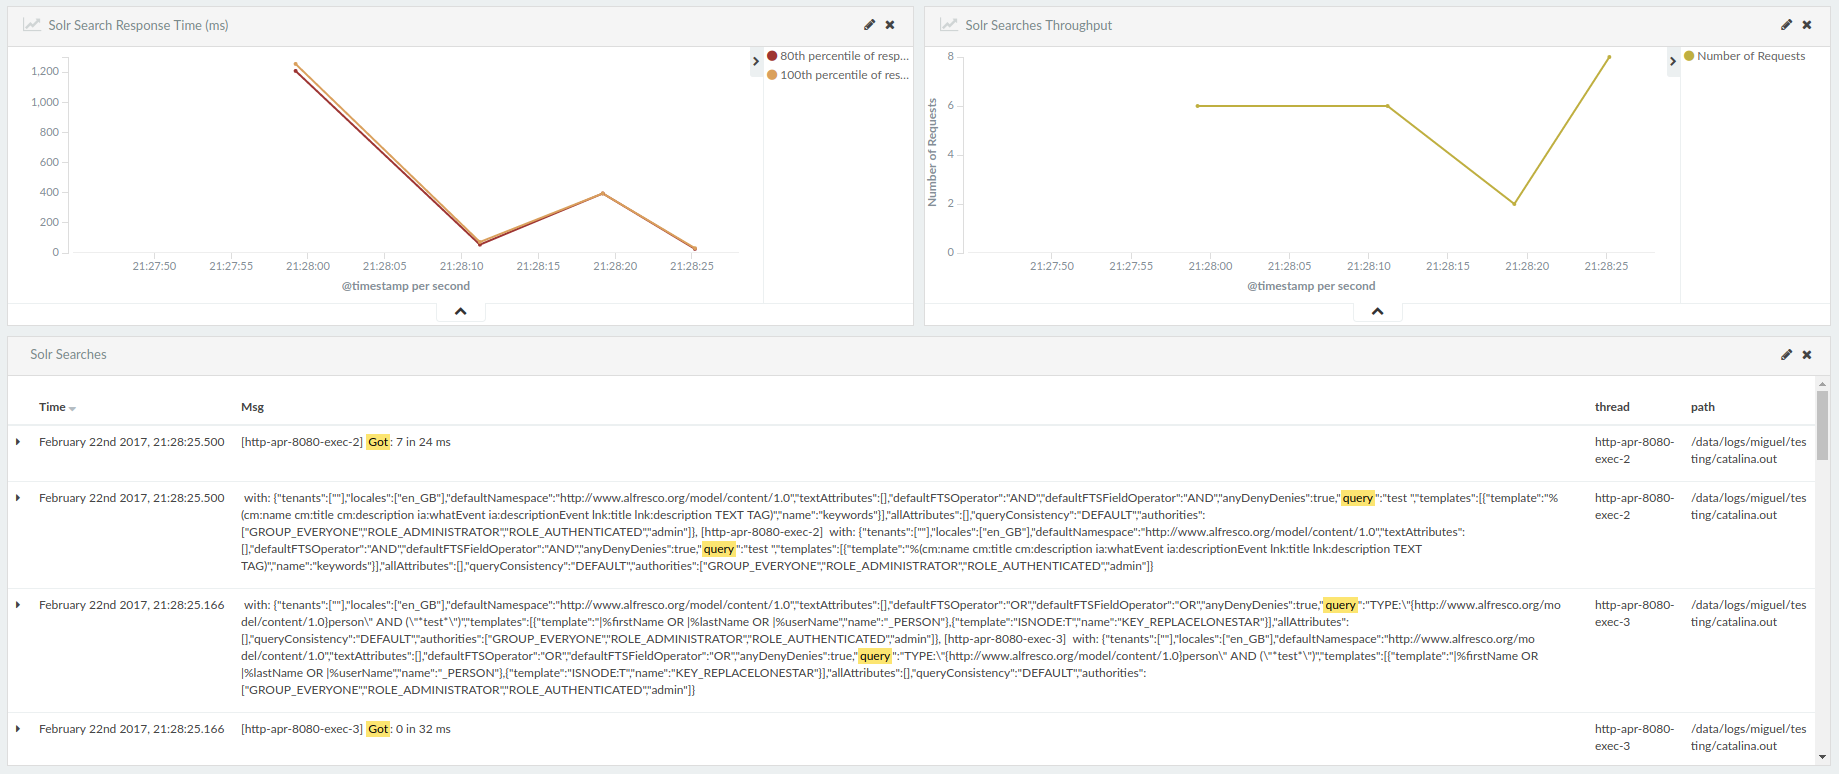
Once Alfresco logs are processed the following data is shown for Solr searches:
- Response time for Solr searches over time
- Solr searches throughput
- Solr queries, number of results found and individual response times
9.5 Database Monitoring
Database performance can be monitored with two different tools: p6spy and packetbeats. The main difference between these tools is that p6spy acts as a proxy jdbc driver and packetbeat is a network traffic sniffer. Also packetbeat can only sniff traffic for MySQL and PostgreSQL databases while p6spy can also do Oracle among others.
P6spy
P6spy software is delivered as a jar file that needs to be placed in the application class path i.e. tomcat/lib/ folder. There are 3 steps to get p6spy configured and running.
- Place p6spy jar file in tomcat/lib/ folder
- Create spy.properties file also in tomcat/lib/folder with the following configuration
modulelist=com.p6spy.engine.spy.P6SpyFactory,com.p6spy.engine.logging.P6LogFactory,com.p6spy.engine.outage.P6OutageFactory appender=com.p6spy.engine.spy.appender.FileLogger deregisterdrivers=true dateformat=MM-dd-yy HH:mm:ss appender=com.p6spy.engine.spy.appender.FileLogger autoflush=true append=true useprefix=true
# Update driver list correct driver i.e. # driverlist=oracle.jdbc.OracleDriver # driverlist=org.mariadb.jdbc.Driver # driverlist=org.postgresql.Driver driverlist=org.postgresql.Driver
# Location where spy.log file will be created logfile=/opt/logstash-agent/logs/spy.log
# Set the execution threshold to log queries taking longer than 1000 milliseconds (slow queries only) executionThreshold=1000 |
Note: if there are no queries taking longer than the value in executionThreshod (in milliseconds) then the file will not be created.
Note: set the “logfile” variable to the logs folder inside the logstash-agent path as shown above.
- Add entry to tomcat/conf/Catalina/localhost/alfresco.xml file
Example for PostgreSQL:
<Resource defaultTransactionIsolation="-1" defaultAutoCommit="false" maxActive="275" initialSize="10" password="admin" username="alfresco" url="jdbc driverClassName="com.p6spy.engine.spy.P6SpyDriver" type="javax.sql.DataSource" auth="Container" name="jdbc/dataSource" /> |
Example for Oracle:
<Resource defaultTransactionIsolation="-1" defaultAutoCommit="false" maxActive="275" initialSize="10" password="admin" username="alfresco" url="jdbc driverClassName="com.p6spy.engine.spy.P6SpyDriver" type="javax.sql.DataSource" auth="Container" name="jdbc/dataSource" /> |
Example for MariaDB:
<Resource defaultTransactionIsolation="-1" defaultAutoCommit="false" maxActive="275" initialSize="10" password="admin" username="alfresco" url="jdbc driverClassName="com.p6spy.engine.spy.P6SpyDriver" type="javax.sql.DataSource" auth="Container" name="jdbc/dataSource" /> |
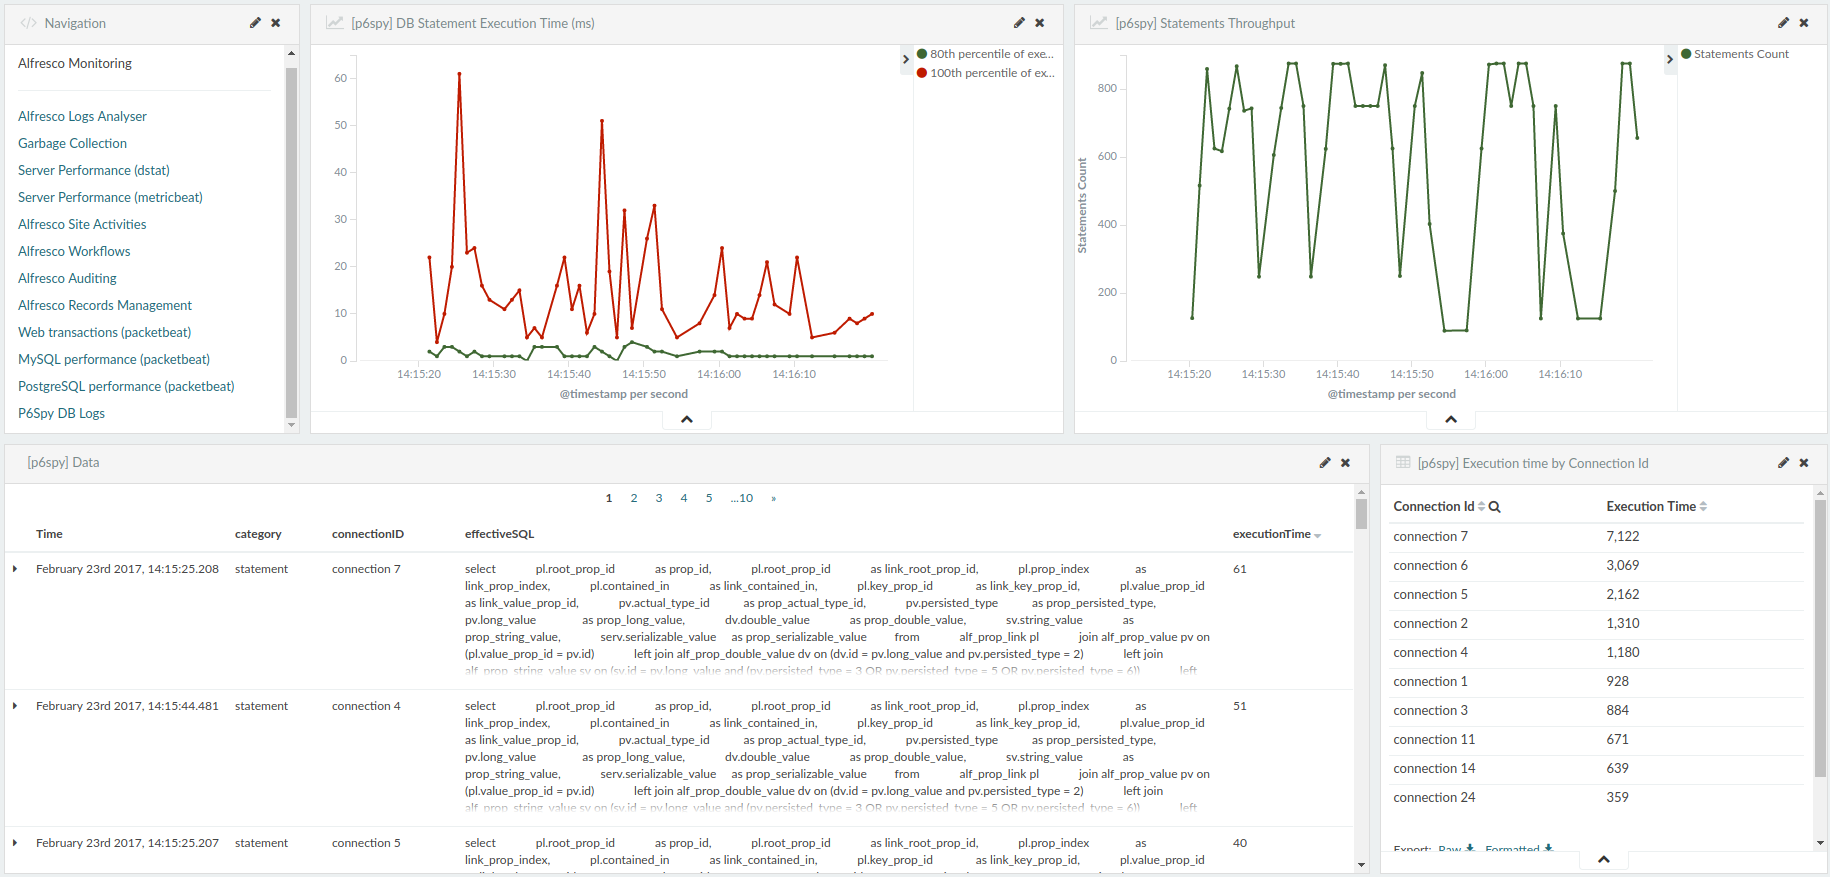
Once the spy.log file has been processed the following information is show:
- DB Statements execution time over time
- DB Statements throughput over time
- Table showing individual DB statements and execution times
- DB execution times by connection id
9.6 Alfresco Auditing
If you want to audit Alfresco access you can enable auditing by adding the following entries to alfresco-global.properties file:
| # Enable auditing audit.enabled=true audit.alfresco-access.enabled=true audit.tagging.enabled=true audit.alfresco-access.sub-actions.enabled=true audit.cmischangelog.enabled=true |
Now you can monitor all the events generated by alfresco-access audit group.
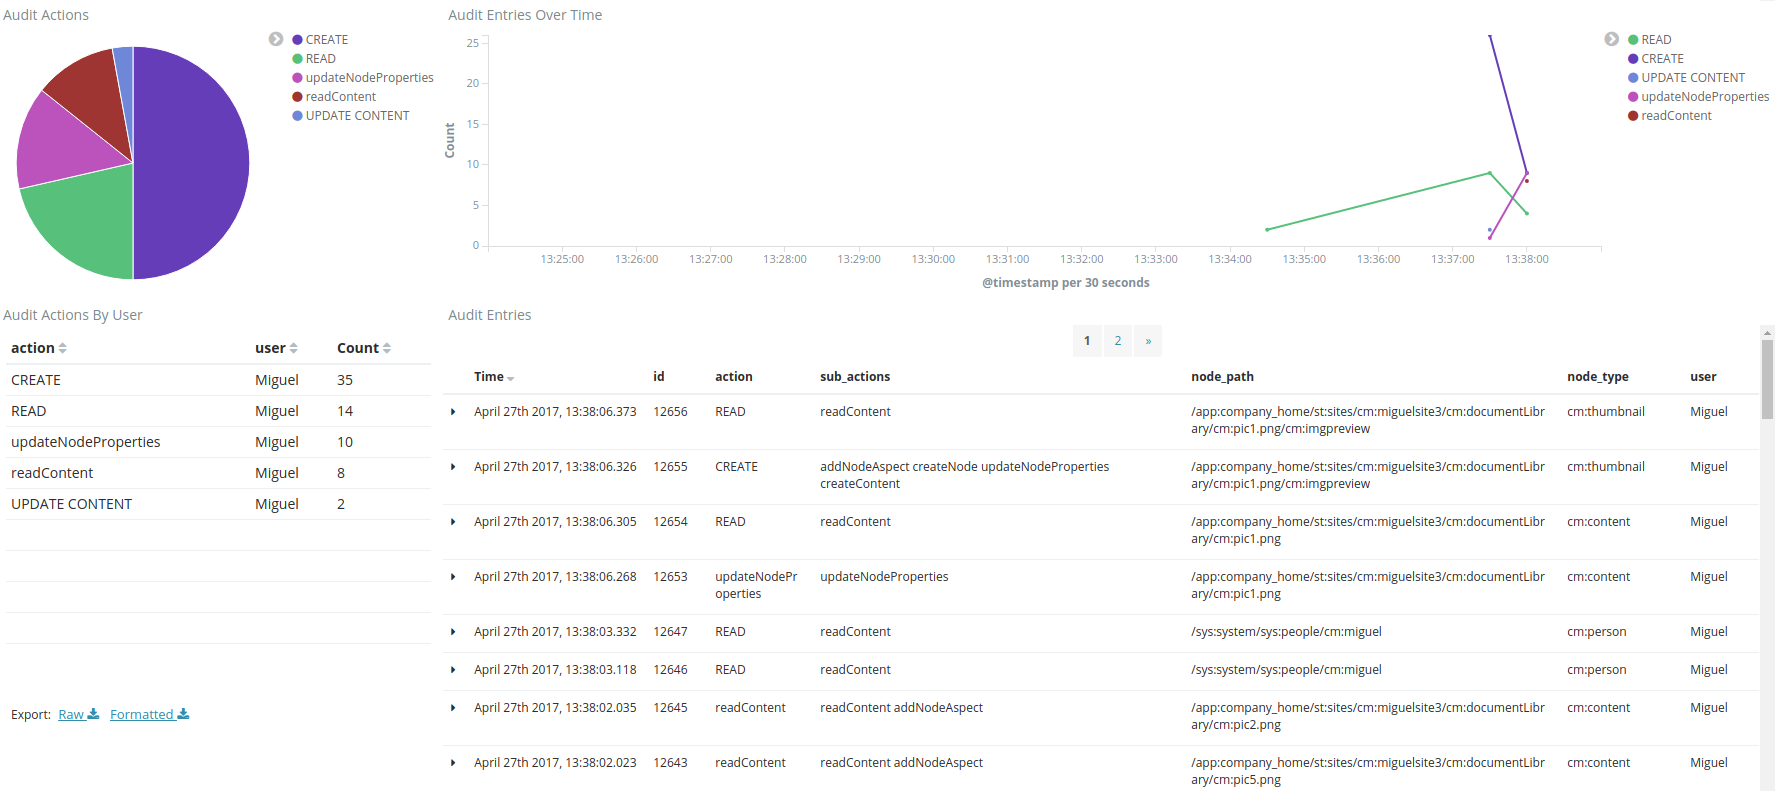
Note: Only one of the logstash agents should collect Alfresco's audit data since the script gathers data for the whole cluster/solution. So edit the file logstash_agent/run_logstash.sh in one of the other Alfresco nodes and set the variable collectAuditData to "yes" as indicated below:
collectAuditData="yes" |
Note: Also make sure you update the login credentials for Alfresco in the audit*sh files. Defaults to admin/admin.
10. Starting and Stopping the logstash agent
The logstash agent script can be started from the command line with "./run_logstash.sh start" as shown below:
| ./run_logstash.sh start Starting logstash Starting jstatbeat Starting dstat Staring audit access script |
and can be stopped with the command "./run_logstash.sh stop" as shown below:
| ./run_logstash.sh stop Stopping logstash Stopping jstatbeat Stopping dstat Stopping audit access script |
11. Accessing the Dashboard
Finally access the dashboard by going to this URL http://<docker host IP>:5601 (use the IP of the server where you installed the Docker container) and clicking on the “Dashboard” link on the left panel and then click on the “Activities” link.
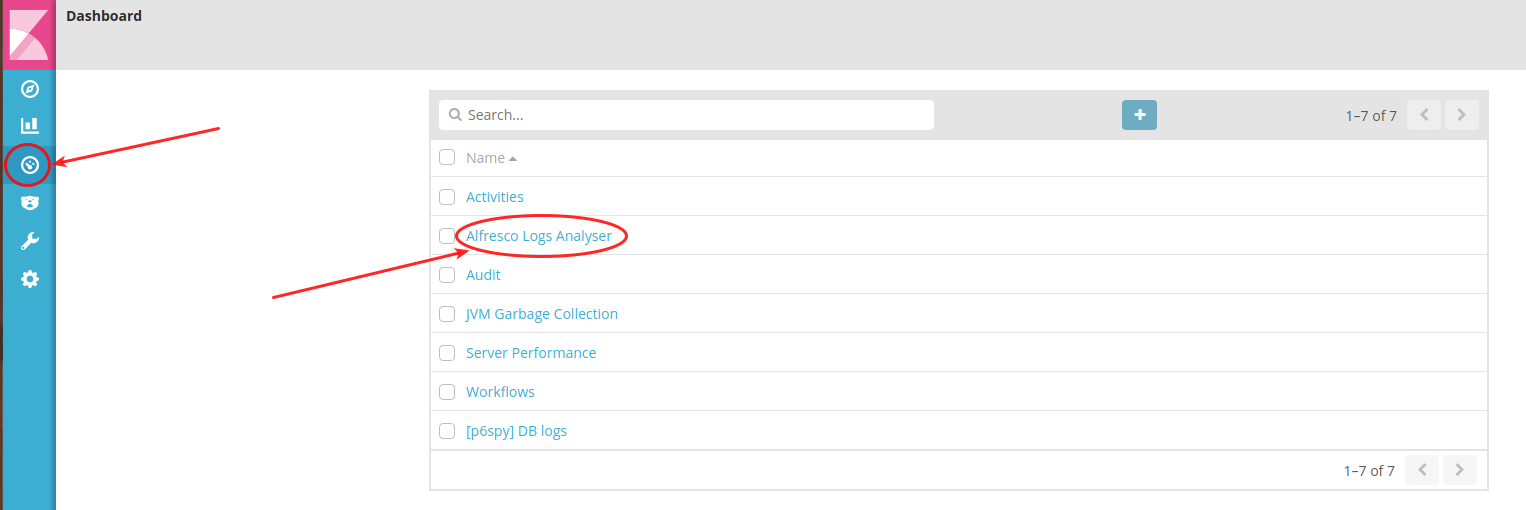
The data should be available for the selected time period.
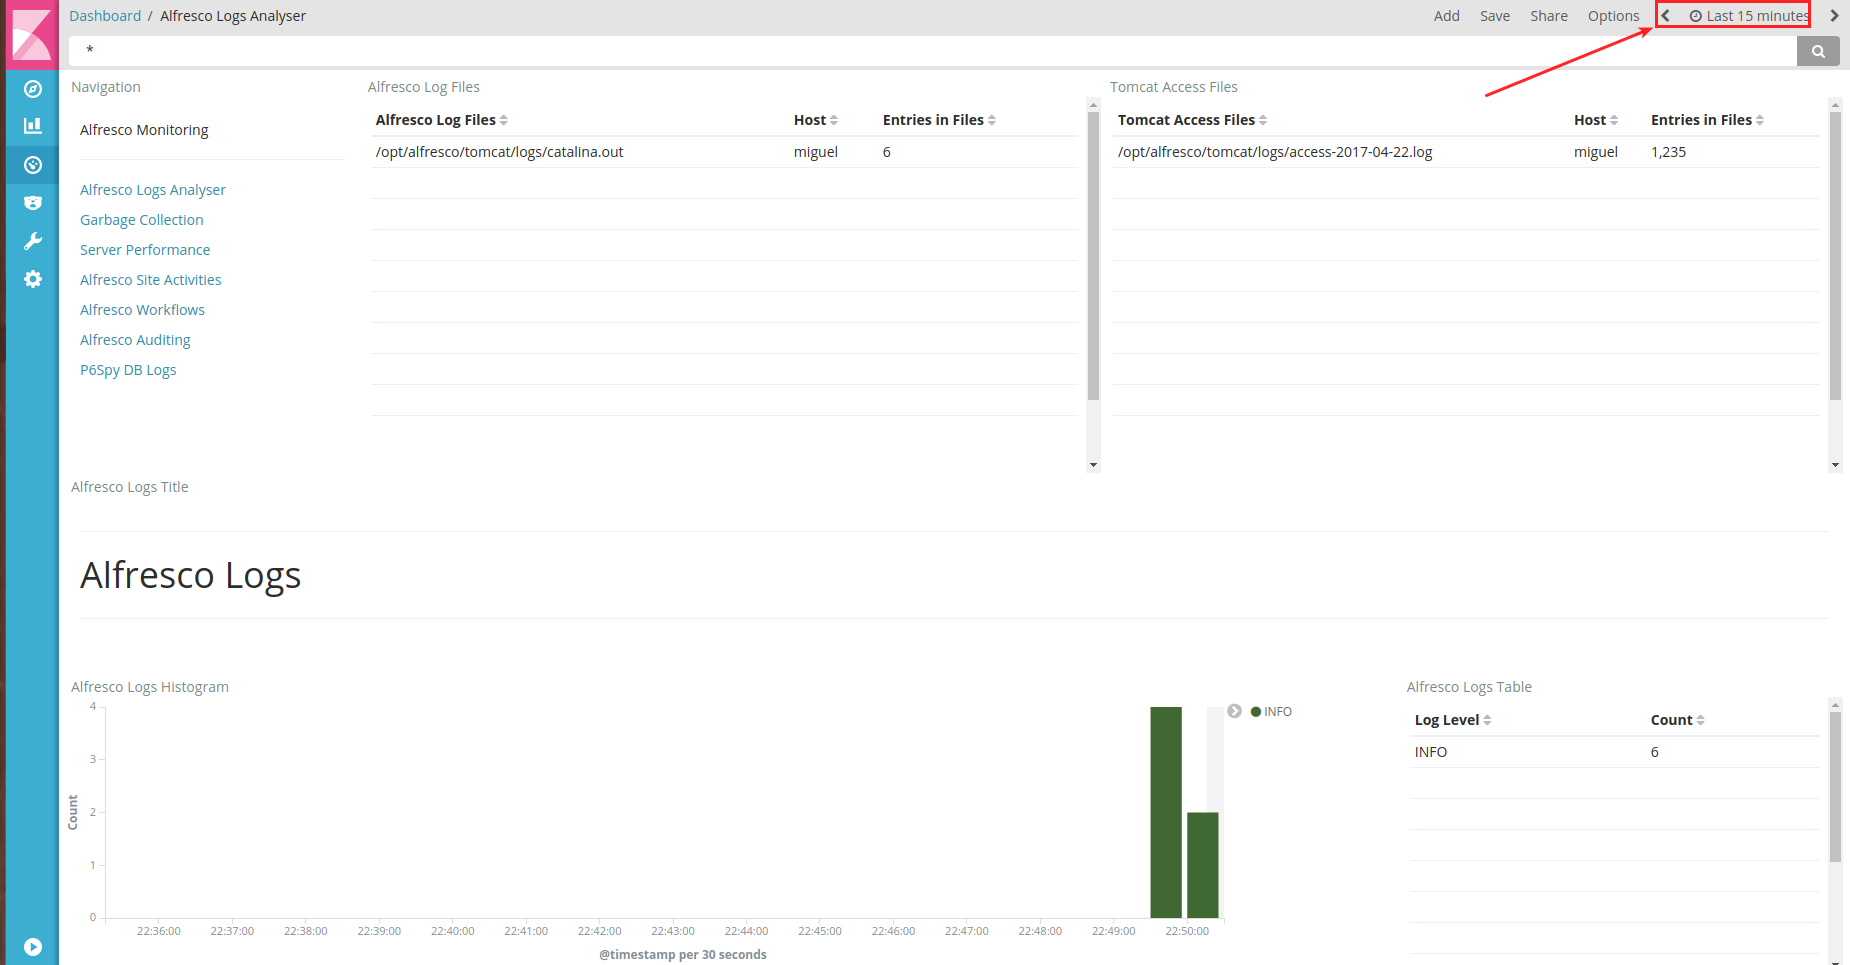
Navigate to the other dashboards by clicking on the appropriate link.

11. Accessing the container
To enter the running container use the following command:
# docker exec -i -t alfresco-elk bash |
And to exit the container just type “exit” and you will find yourself back on the host machine.
12. Stopping the container
To stop the container from running type the following command on the host machine:
| Header 1 |
|---|
# docker stop alfresco-elk |
13. Removing the Docker Container
To delete the container you first need to stop the container and then run the following command:
# docker rm alfresco-elk |
14. Removing the Docker Image
To delete the container you first need to stop the container and then run the following command:
# docker rmi alfresco-elk:latest |
15. Firewall ports
If you have a firewall make sure the following ports are ope:
Redis: 6379
Kibana: 5601
Database server: this depends on the DB server being used i.e. PostgreSQL is 5432, MySQL 3306, etc
Happy Monitoring!!!
You must be a registered user to add a comment. If you've already registered, sign in. Otherwise, register and sign in.
Ask for and offer help to other Alfresco Content Services Users and members of the Alfresco team.
- Alfresco 6.1 in Azure (VM based deployment)
- Deploying ACS 6.1 Enterprise on AWS with Packer an...
- Collaborative Edition on Alfresco using LibreOffic...
- Upgrading Alfresco without the content binary file...
- WCMQS Part II
- How change color and font in APS inside a checkbox...
- Solr monitoring (using Nagios and alikes)
- Migration of All-In-One project to SDK 3.0
- DevCon 2018 Retrospective
- Troubleshooting slow queries - PostgreSQL
- Indexing images with text in Alfresco with Tessera...
- Alfresco Content Connector for Salesforce - Notes ...
- Alfresco Monitoring with Docker and ELK
- Troubleshooting Alfresco Content Services Performa...
- WCMQS Part I
We use cookies on this site to enhance your user experience
By using this site, you are agreeing to allow us to collect and use cookies as outlined in Alfresco’s Cookie Statement and Terms of Use (and you have a legitimate interest in Alfresco and our products, authorizing us to contact you in such methods). If you are not ok with these terms, please do not use this website.
